Where Is Homebuyer Affordability Improving?
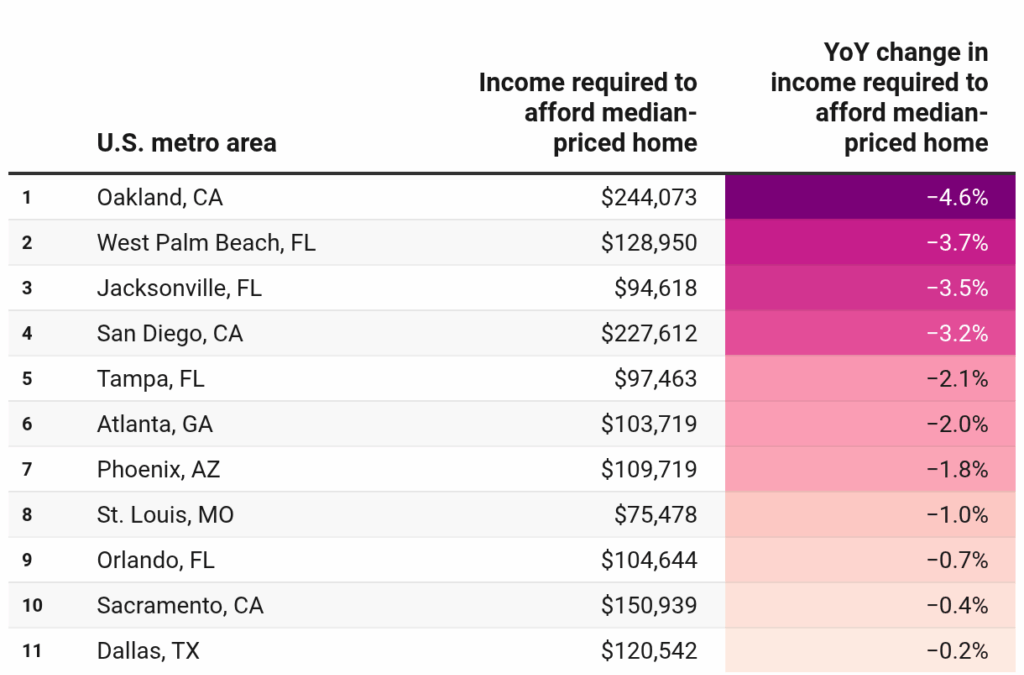
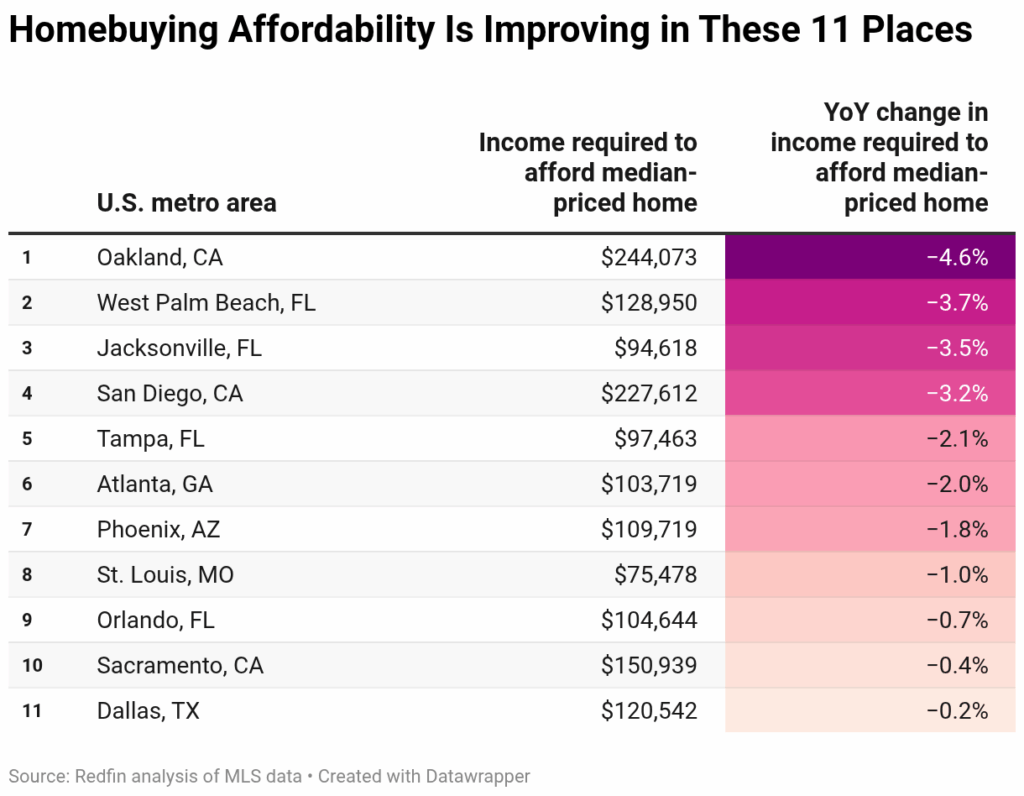
New data from Redfin reveals that homebuyers need to earn $112,131 per year to afford a $447,035 median-priced U.S. home … with little having changed (positive point five percent) year-over-year. But in eleven of the fifty most populous U.S. metropolitan areas, the income needed to afford a home has declined.
In Oakland, California, homebuyers need to earn $244,073 to afford the typical home. While that’s high compared to most places, it’s down four point six percent year-over-year—the largest decline among the fifty most populous U.S. metropolitan areas. Oakland was followed by West Palm Beach, Florida (negative three point seven percent); Jacksonville, Florida (negative three point five percent); San Diego, California (negative three point two percent); Tampa, Florida (negative two point one percent); Atlanta, Georgia (negative two percent); Phoenix, Arizona (negative one point eight percent); St. Louis, Missouri (negative one percent); Orlando, Florida (negative point seven percent); Sacramento, California (negative point four percent); and Dallas, Texas (negative two percent).
The majority of these eleven metros are located in Sun Belt states that exploded in popularity and price during the pandemic, and are now seeing home prices come back down to earth. Many pandemic boomtowns ramped up construction to accommodate newcomers, leading to an influx of supply that put downward pressure on home prices.
“Buyers are battling affordability and they see a lot of listings sitting on the market, so they’re asking for major concessions,” said Katie Shook, a Redfin Premier Real Estate Agent in Phoenix. “We’ve been in a buyer’s market for the past eight months. If your home isn’t in 10/10 condition and priced at or below market value, it’s going to linger on the market. A lot of sellers are offering $10,000-$15,000 to cover the buyer’s closing costs to seal the deal. Some home features, like a landscaped backyard or pool, aren’t getting the return they used to. Buyers are no longer willing to pay a premium for those things.”

Four of the eleven metros where the income needed to afford a home is falling are in Florida, which has also seen home prices drop amid soaring insurance and HOA costs, along with intensifying natural disasters. Many insurance companies are leaving the Sunshine State entirely, limiting coverage, or are raising their premiums. Home insurance companies have always been wary of the Florida market due to the dangers of climate-related damage.
While homebuying has become more affordable in some parts of the country, the typical household still earns far less than it needs to afford the typical home; the typical U.S. household earns an estimated $86,258—roughly $25,000 less than the income required to afford the typical home for sale.
Midwest Metros Trend Upward
Some of the nation’s most affordable regions are experiencing the biggest gains in the income required to afford a home—likely due to their low cost of living has attracted homebuyers, pushing up prices.
In Detroit, the income required to afford a home is up nine point nine percent year-over-year, the biggest increase among the top fifty metros. But it is still only at $57,432—the lowest in the country. That is because even though Detroit’s median sale price is up eight point nine percent year-over-year—the second biggest increase in the nation—it remains the lowest in the country ($215,000).
Cleveland saw the second biggest increase in the income needed to afford a home (positive eight point two percent year-over-year), followed by Newark, New Jersey (six point eight percent); Chicago, Illinois (positive six point seven percent); and Pittsburgh, Pennsylvania (positive five point seven percent).
How Much Income Is Spent on Housing?
Many say that no more than thirty percent of one’s income should be spent on housing, but that unwritten rule has become less realistic as housing costs have climbed.
A household on the median income would need to spend thirty nine percent of their earnings on housing to buy the median priced home. But there is some good news: That is down from forty point five percent last year, likely because incomes have risen while home prices have barely budged (the median U.S. home sale price is up just one percent year-over-year).
Approximately one-third (thirty four point six percent) of home listings are affordable for the typical U.S. household, that is up slightly from thirty three point two percent a year ago.
Realtor.com reports that the inventory of homes for sale rose 24.8% year-over-year, marking the 21st consecutive month of inventory growth and the third consecutive month with more than one million active listings. July 2025 inventory hit a new post-pandemic high, but remains thirteen point four percent below pre-pandemic levels.
While July may mark the twenty first consecutive month of inventory gains, the pace of growth is beginning to slow. Active listings rose less than in prior months—down from twenty eight point nine percent in June, and thirty one point five percent in May—suggesting the post-pandemic inventory recovery could be slowing. Nationally, total active listings in July remained thirteen point four percent below typical 2017-2019 levels, a slightly wider gap than last month’s twelve point nine percent shortfall. Overall, inventory growth is slightly decelerating after rapidly rising in early spring.
Regionally, compared with pre-pandemic norms, Realtor.com found inventory in the West (positive nine point three percent) and South (positive four point three percent) has recovered. But the Midwest (negative forty percent) and Northeast (negative fifty one point one percent) continue to lag significantly. These patterns follow regional construction trends since the COVID-19 pandemic and longstanding housing supply gaps. May 2025’s report also documented the strong correlation between metro-level new-construction and post-pandemic inventory recovery, with new construction in the South leading the way in closing its pandemic inventory gap.
Click here for more on Redfin’s analysis of the nation’s top regions showing an improvement in affordability.
The post Where Is Homebuyer Affordability Improving? first appeared on The MortgagePoint.

FIRST TIME HOMEBUYERS
Buyer’s Agents Explained
HOMEBUYERS BEWARE! Book Review
This book is an excellent first step in a complicated process.

BEWARE the cards are stacked against you! Get Tom Wemett's book, learn why are different from other
Buying a home is like buying a car, on steroids. It’s the biggest investment you are likely to make so the stakes are incredibly high. I knew that having an agent represent me was a good idea.
What I hadn’t grasped was how important it is to find one who is not connected with the selling side in any way—through an agency that also represents sellers, as most do, at least in Mass. In researching buyer agents, I found Tom through the Mass. Assoc. of Buyer Agents (MABA).
Article From: "Eric C. Peck" Read full article
Get Started with MABA
For no extra cost, let a MABA buyer agent protect your interests
800-935-6222 Call now!
How to Make Better Homebuying Decisions

Who Pays a Buyer’s Agent?

![]()