
Quarter One Profit Margins on U.S. Home Sales Fall MABA MassachusettsRealEstate FirstTimeHomeBuyers MaBuyerAgent
According to a new study by ATTOM of first quarter 2025 housing data, homeowners, on average, made a fifty point two percent profit selling single-family homes and condos during quarter one of the year down three point two percentage points from the previous quarter, and down four point eight percentage points from quarter one of 2024.
The national median profit margin for home sales has declined slightly almost every quarter since the summer of 2022, but it still remains above pre-pandemic levels.

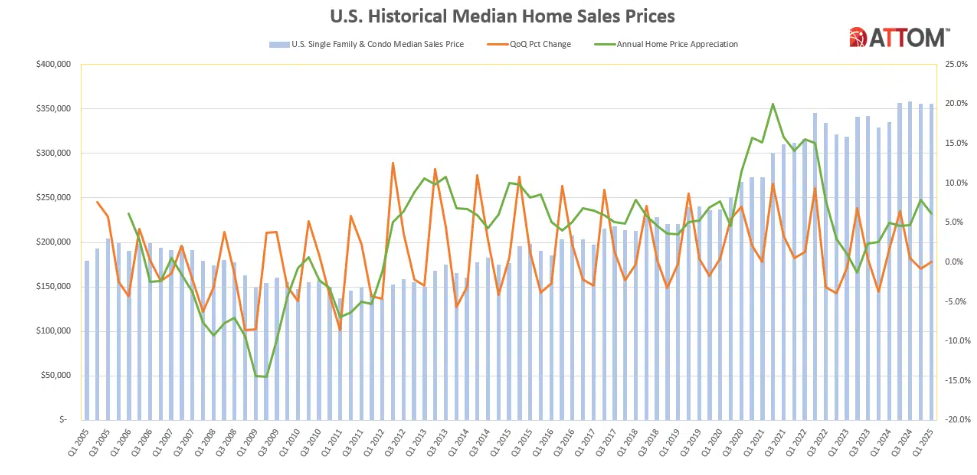
The national median home sale price whose historic peak was three hundred and fifty eight thousand dollars in quarter three of 2024 has held steady for the last two quarters at three hundred and fifty five thousand dollars. However, the median raw profit that sellers made on their homes dropped about four percent from about one hundred and twenty four thousand dollars in quarter four of 2024 to one hundred and nineteen thousand dollars in quarter one of 2025.
“Sellers may not be enjoying quite the same windfall they were a few years ago, but by historical standards, profits are strong, both in terms of margins and raw dollar value,” said Rob Barber, CEO for ATTOM. “The first quarter also tends to be the weakest of the year, so don’t be surprised to see profits regain ground during the summer months.”
Where Are Profit Margins Slipping?
Compared to quarter four of 2024, typical profit margins dropped in ninety nine (seventy seven percent) of the one hundred and twenty eight metropolitan statistical areas that had at least one thousand home sales during quarter one of 2025. Typical profit margin is the percent difference between the median purchase price and median resale price for homes in an area. Compared to the same time last year, typical profit margins fell in one hundred and six (eighty three percent) of the one hundred and twenty eight metro areas.
The biggest year-over-year decreases in typical profit margins during quarter one of 2025 came in:
- Punta Gorda, Florida (down from one hundred and six point three percent to sixty nine point two percent)
- Ocala, Florida (down from ninety nine point nine to sixty six point seven percent)
- Deltona, Florida (down from eighty one point six to fifty four percent)
- Bakersfield, California (down from eighty one point one to fifty eight point nine percent)
- Spartanburg, South Carolina (down from forty nine point four to twenty nine point six percent)
The largest year-over-year increases in typical profit margins for quarter one of 2025 were reported in:
- Toledo, Ohio (up from twenty seven point eight to forty four point seven percent)
- Birmingham, Alabama (up from twenty four point nine to thirty five point one percent)
- Canton, Ohio (up from forty three point eight to fifty three point one percent)
- Syracuse, New York (up from fifty six point eight to sixty two point three percent)
- Youngstown, Ohio (up from sixty four point seven to seventy percent)
Among metro areas with populations over one million, the biggest year-over-year decreases in typical profit margins were reported in:
- San Jose, California (down from one hundred and five to eighty eight point eight percent)
- Tampa, Florida (down from seventy three point nine to fifty nine point one percent)
- Fresno, California (down from seventy five to sixty point eight percent)
- San Francisco, California (down from seventy eight point three to sixty four point three percent)
- Jacksonville, Florida (down from fifty nine point six to forty seven point four pewrcent)
And among those largest metro areas, including Birmingham, Alabama, the biggest year-over-year improvement in typical sales profit margins came in:
- Chicago, Illinois (up from forty one point nine to forty five point two percent)
- Buffalo, New York (up from seventy nine point one to eighty two point two percent)
- Cleveland, Ohio (up from fifty two point nine to fifty five point four percent)
- Virginia Beach, Virginia (up from thirty seven point eight to thirty nine point eight percent)
Investment Returns on the Rise
Despite the profit margins shrinking nationwide, home sellers are still seeing comparatively high returns on their investments. Of the one hundred and twenty eight metro areas in our analysis, seventy seven (sixty percent) had typical sales profit margins at or above fifty percent.
Among metro areas with at least one million residents, the highest typical profit margins were reported in:
- San Jose, California (eighty eight percent)
- Buffalo, New York (eighty two point two percent)
- Seattle, Washington (seventy five point three percent)
- Providence, Rhode Island (seventy four point one percent)
- Boston, Massachusetts (seventy three point nine percent)
Of the largest metro areas, the lowest typical profit margins were found in:
- New Orleans, Louisiana (eighteen point one percent)
- San Antonio, Texas (twenty four point five percent)
- Dallas, Texas (twenty nine point seven percent)
- Austin, Texas (thirty two point seven percent)
- Houston, Texas (thirty five percent)
Raw Profits Hold Steady
Compared to the same time last year, the national typical raw profit on home sales the median dollar amount difference between how much sellers purchased homes for and how much they sold them for stayed essentially the same at just below one hundred and nineteen thousand dollars.
However, some metro areas saw significant changes in the typical raw profit from sales. Of the one hundred and twenty eight metro areas analyzed, seventy four (fifty eight percent) saw typical raw profits drop year-over-year.
Among metro areas with populations over one million, the biggest year-over-year decrease in raw profit were found in:
- New Orleans, Louisiana (down twenty seven point six percent)
- Dallas, Texas (down seventeen point eight percent)
- Tampa, Florida (down fifteen percent)
- Jacksonville, Florida (down fourteen point two percent)
- Austin, Texas (down thirteen percent)
Still, seventy nine (sixty two percent) of the one hundred and twenty eight metro areas had typical raw profits that exceeded one hundred thousand dollars, with coastal cities, particularly in California, leading the way. The metro areas with the largest typical raw profits in quarter one of 2025 were:
- San Jose, California (seven hundred and ten thousand dollars)
- San Francisco, California (four hundred and eleven thousand dollars)
- San Diego, California (three hundred and sixty thousand dollars)
- Los Angeles, California (three hundred and forty thousand dollars)
- Oxnard, California (three hundred and seventeen thousand and fifty dollars)
The metro areas with the smallest typical raw profits were found in:
- New Orleans, Louisiana (thirty eight thousand dollars)
- Baton Rouge, Louisiana (forty two thousand five hundred dollars)
- Springfield, Missouri (forty four thousand nine hundred and thirty six dollars)
- Toledo, Ohio (forty nine thousand six hundred and eighty nine dollars)
- Birmingham, Alabama (fifty thousand and eight hundred dollars)
Median Home Values Remain High
The national median home sales price hit a record high of three hundred and fifty eight thousand dollars in quarter three of 2024. Since then, it has dropped slightly about point eight percent but is still six percent higher than it was at the end of quarter one in 2024. The typical sales value grew year-over-year in eighty five percent of the metro markets analyzed, and quarter-over-quarter in twenty six percent of the metro markets.
The metro areas that saw the largest year-over-year increase in typical sales prices were found in:
- Syracuse, New York (up eighteen point eight percent to two hundred fourteen thousand nine hundred and fifty dollars)
- Toledo, Ohio (up eighteen point five percent to one hundred and sixty thousand dollars)
- Kansas City, Missouri (up sixteen point one percent to two hundred and ninety thousand two hundred and three dollars)
- Louis, Missouri (up fourteen percent to two hundred and forty thousand dollars)
- Dayton, Ohio (up fourteen point three percent to two hundred thousand dollars)
The metro areas with the biggest year-over-year decreases in typical sales prices were:
- Cape Coral, Florida (down nine percent to three. hundred and fifty five thousand dollars)
- Sarasota, Florida (down six percent to four hundred and thirty thousand two hundred and seventy eight dollars)
- Boise City, Idaho (down five point two percent to four hundred and forty eight thousand nine hundred and forty one dollars)
- Punta Gorda, Florida (down four point five percent to three hundred and fifteen thousand dollars)
- Tampa Bay, Florida (down three point four percent to three hundred and fifty thousand dollars)
Owners Play the Waiting Game
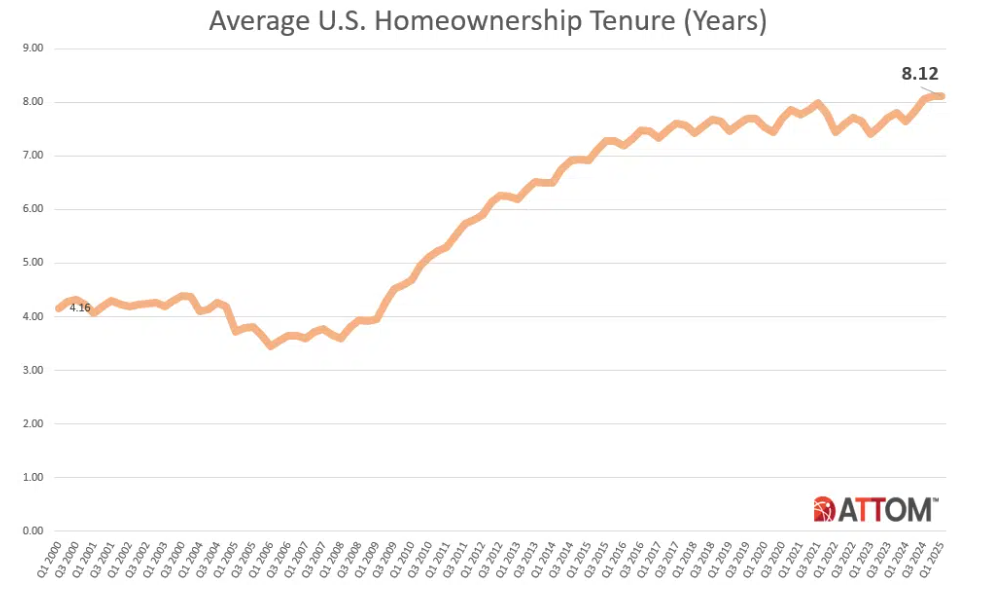
The average amount of time owners hold onto a home before selling it has been steadily increasing since 2006. For homes sold in quarter one of 2025, the average amount of time between purchase and sale was eight point tweleve years, the same amount of time as in quarter four of 2024 but almost six months longer than homes sold in quarter one of 2024.
The average length of ownership between sales increased quarter-over-quarter in fifty nine (fifty two percent) of one hundred and fourteen metro areas with sufficient data to analyze. Year-over-year, the average length of ownership increased in ninety six metro areas (eighty four percent).
The metro areas with the longest ownership tenure for homes sold in quarter one of 2025 were:
- Barnstable, Massachusetts (fourteen point eight years)
- New Haven, Connecticut (thirteen point one years)
- Eureka, California (twelve point nine years)
- Bridgeport, Connecticut (twelve point six years)
- Torrington, Connecticut (twelve point two years)
The metro areas with the shortest average ownership tenures were found in:
- Provo, Utah (six point two years)
- Crestview, Florida (six point eight years)
- Oklahoma City, Oklahoma (six point nine years)
- Austin, Texas (six point nine years)
- Kansas City, Missouri (seven years)
Click here for more on ATTOM’s analysis of quarter one U.S. home sales.
The post Q1 Profit Margins on U.S. Home Sales Fall first appeared on The MortgagePoint.

FIRST TIME HOMEBUYERS
Client Testimonial:
 "No amount of reading or web surfing can equal having a competent professional advising you and looking out for your interests. I do not understand why anyone would buy a house in MA without a MABA buyer's broker."
- Samantha and Brendan, Purchased a home in Marlborough, MA 2012
Article From: "Eric C. Peck" Read full article
Get Started with MABA
For no extra cost, let a MABA buyer agent protect your interests
800-935-6222 Call now!
How to Make Better Homebuying Decisions

Who Pays a Buyer’s Agent?

![]()