Slowing Demand Leaves Homebuyers With More Options MABA MassachusettsRealEstate FirstTimeHomeBuyers MaBuyerAgent
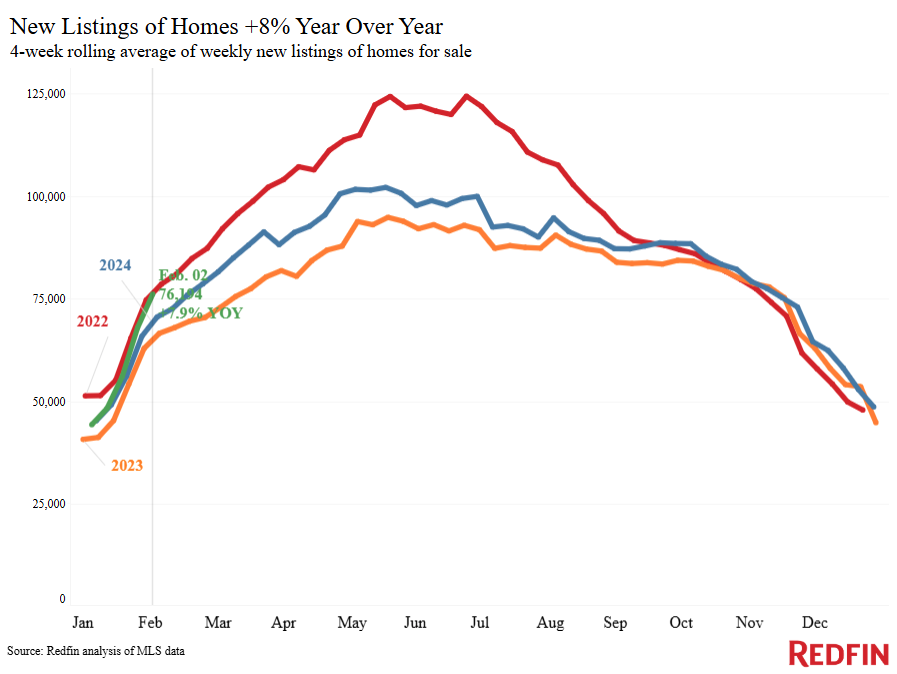
New Redfin data reported the largest gain since the end of last year occurred in the four weeks ending February 2nd, when new listings of homes for sale in the U.S. increased seven point nine percent from a year earlier.
On the purchasing side, pending sales are down eight point one percent year-over-year, (YoY) despite a little improvement from the previous month. At early phases of the homebuying process, the situation is comparable: Although it increased little from the previous week, Redfin’s Homebuyer Demand Index, which is a seasonally adjusted indicator of tours and other purchasing services from Redfin agents, is still close to its lowest point since last spring.
“Listings are picking up as we inch toward spring,” said Joe Paolazzi, a Redfin Premier agent in Pittsburgh. “Homeowners have been holding off, waiting for mortgage rates to go down or market conditions to improve, and now it seems clear rates have declined about as much as they’re going to decline for now.”
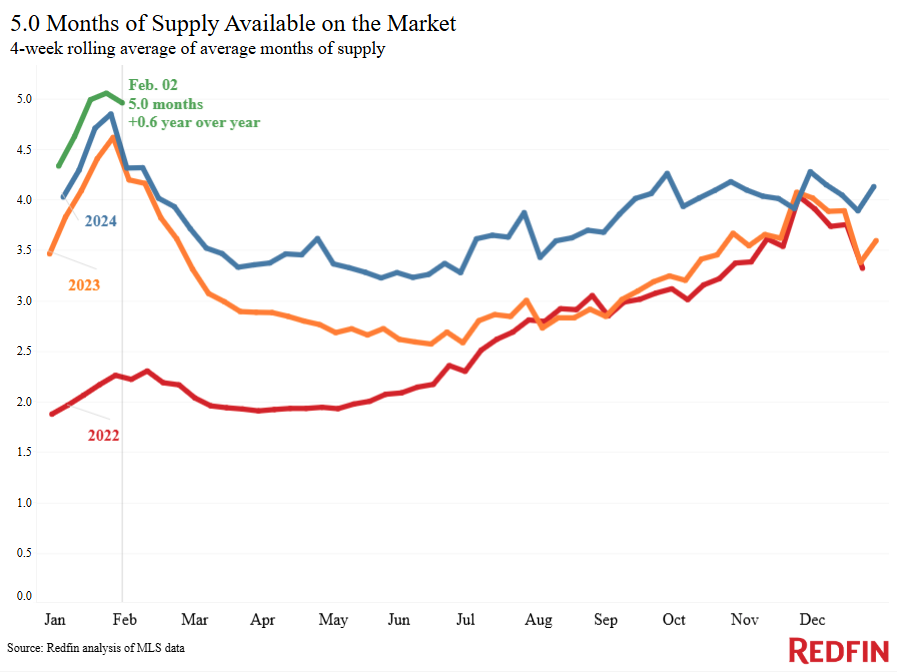
A larger pool of options is becoming available to homebuyers as a result of the increase in new listings and the decline in sales. With the exception of the previous four-week period, there is the highest supply on the market in six years, with five months available, up from four point four months a year ago.
National Housing Market Data — Key Highlights
| U.S. Highlights: Four weeks ending Feb. 2, 2025 | Four weeks ending Feb. 2, 2025 | Year-over-year (YoY) change |
| Median sale price | three hundred seventy six thousand seven hundred and fifty dollars | four point six percent |
| Median asking price | four hundred and twelve thousand one hundred and fifty seven dollars | five point seven percent |
| Median monthly mortgage payment | two thousand seven hundred and eight four dollars (At a six point ninety five percent mortgage rate) | eight point three percent (Just twenty one dollars shy of April’s all-time high) |
| Pending sales | sixty five thousand six hundred and three | negative eight point one percent |
| New listings | seventy six thousand one hundred and ninety four | seven point nine percent (Biggest increase in five weeks) |
| Active listings | eight hundred and ninety seven thousand seven hundred and ninety eight | twelve point five percent (Smallest increase in nearly a year) |
| Months of supply of homes | five | positive point six pts. to longest span since Feb. 2019, except the prior four week period (four to five months of supply is considered balanced, with a lower number indicating seller’s market conditions) |
| Share of homes off market in two weeks | twenty nine percent | Down from thirty two percent |
| Median days on market | fifty five | positive six days to longest span in nearly five years |
| Share of homes sold above list price | twenty point seven percent | Down from twenty two percent |
| Average sale-to-list price ratio | ninety eight percent | Down from ninety eight point one percent |
Note: Redfin’s national metrics include data from four hundred plus U.S. metro areas, and are based on homes listed and/or sold during the period. Weekly housing-market data goes back through 2015. Subject to revision.
Potential purchasers are delaying for a number of reasons. First, prices are still close to record highs, despite the fact that homes are usually selling for less than the asking price. The median monthly housing payment is now $2,784, up eight point three percent year-over-year and only $21 short of the all-time high due to stubbornly high property prices and mortgage rates.
“Sellers are also noticing that even though there are fewer buyers in the market than usual, the buyers who are on the hunt are serious and willing to pay a fair price,” Paolazzi said. “There are bidding wars for homes in desirable neighborhoods, and for investment properties that would be easy to rent out.”
It is noteworthy, however, that for the first time since mid-December, daily average mortgage rates fell below seven percent this week. Second, some consumers are holding off on making a big purchase because they are unsure of the federal government’s economic policies. Lastly, in January, many homebuyers stayed indoors due to snow and the bitter cold in the Midwest, Northeast, and South.
Metro-Level Highlights — Four weeks ending Feb. 2, 2025
As said, slow sales combined with an increase in new listings is creating a larger supply for homebuyers to pick from. Additionally, it has caused the average property to sell for two percent less than the asking price, which is the largest reduction in two years; yet, housing expenses remain extremely high.
The top five metros with biggest YoY increases in new listings:
- Orlando, FL (27.7%)
- San Jose, CA (26.7%)
- Oakland, CA (26.1%)
- Tampa, FL (25.6%)
- Phoenix (23.8%)
Despite an uptick in these popular Sun Belt cities, new listings declined in 12 U.S. metros.
The top five metros with biggest YoY decreases in new listings:
- Detroit (-13.9%)
- San Antonio (-13.5%)
- Chicago (-11.3%)
- Atlanta (-6.6%)
- Indianapolis (-6.1%)

The top five metros with biggest YoY increases in median sale price:
- Pittsburgh (15.7%)
- New Brunswick, NJ (12.1%)
- Newark, NJ (12.1%)
- Nassau County, NY (11.5%)
- Fort Lauderdale, FL (11.2%)
While many popular cities remain pricey, it’s no surprise that the U.S. median sale price declined in five buzzing metros across the nation.
The top five metros with biggest YoY decreases in median sale price:
- Austin, TX (-5.5%)
- Tampa, FL (-3.5%)
- San Francisco (-1.9%)
- Jacksonville, FL (-0.8%)
- Atlanta (-0.6%)

Leading Indicators of Homebuying Demand & Activity — National
| Recent change | YOY change | Source | |
| Weekly average 30-year fixed mortgage rate | Down from 7.04% 2 weeks earlier, but still near highest level since May | Up from 6.63% | Freddie Mac |
| Mortgage-purchase applications (seasonally adjusted) | Down 4% from a week earlier (as of week ending Jan. 31) | Essentially unchanged (+0.2%) | Mortgage Bankers Association |
| Redfin Homebuyer Demand Index (seasonally adjusted) | Near lowest level since July (as of week ending Feb. 2) | Down 4% | Redfin Homebuyer Demand Index (a measure of tours and other homebuying services from Redfin agents) |
| Touring activity | Up 13% from the start of the year (as of Feb. 3) | At this time last year, it was up 13% from the start of 2024 | ShowingTime |
| Google searches for “home for sale” | Essentially unchanged from a month earlier (as of Feb. 2) | Essentially unchanged | Google Trends |
To read the full report, including more data, charts, and methodology, click here.
The post Slowing Demand Leaves Homebuyers With More Options first appeared on The MortgagePoint.

FIRST TIME HOMEBUYERS
"The MABA agent helped us find the perfect home for us at the right price and we felt extremely good about the final deal."
Article From: "Demetria C. Lester" Read full article
Get Started with MABA
For no extra cost, let a MABA buyer agent protect your interests
800-935-6222 Call now!
How to Make Better Homebuying Decisions

Who Pays a Buyer’s Agent?

![]()